
Business Intelligence Dashboard & Analytics UI
Business Intelligence Dashboard & Analytics UI
Project Overview
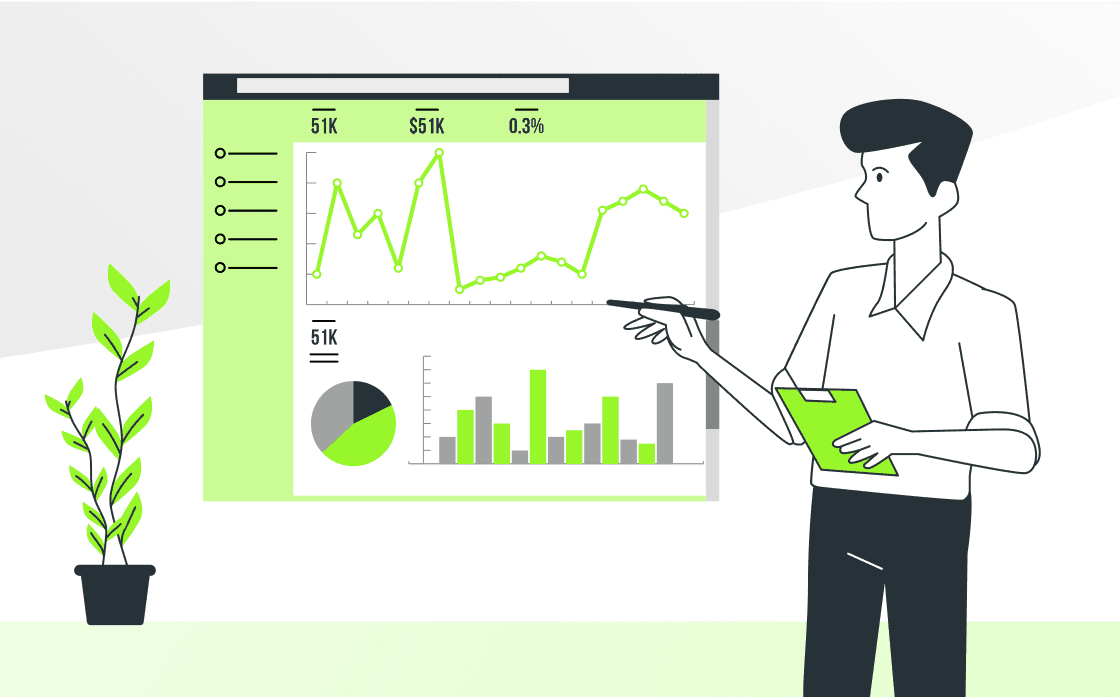
At DigiNEXT, we designed a smart business dashboard tailored to empower decision-making through real-time insights and intuitive design. Our goal was to turn raw data into actionable analytics using customized data widgets, simplified navigation, and responsive layout. The dashboard streamlined operations, enhanced visibility across departments, and aligned with the client’s digital transformation strategy in Bangalore.
Challenges & Constraints
Complex datasets coming from multiple platforms (CRM, sales, operations).
Required a flexible dashboard design to serve varied roles (CXOs to field staff).
Needed real-time data refresh and high performance even on low-bandw
Our Strategy & Solutions
Data Integration APIs: Connected multiple data sources including CRMs, ERPs, and third-party tools for unified visibility.
Custom Dashboard UI: Created role-based dashboard views — from analytics managers to sales heads — using easy-to-understand widgets and graphs.
Performance Optimization: Implemented lazy loading, compressed graphs, and caching to ensure smooth performance with heavy datasets.
Visual Analytics Design: Used compelling visuals, color-coded insights, and iconography to boost readability and fast decision-making.
Outcome & Results
Decision-making speed improved by 40% thanks to centralized and visualized analytics.
Operational efficiency increased by 30%, reducing delays across teams.
Positive user feedback for its clean design, fast performance, and real-time visibility.
Client now relies on this dashboard for key performance tracking and forecasting.
Project Name
Business Intelligence Dashboard & Analytics UI
Category
Data Visualization & Analytics
Clients
Priya Sharma
Date
Dec 31, 2024
Duration
3 Weeks